Dashboard Overview
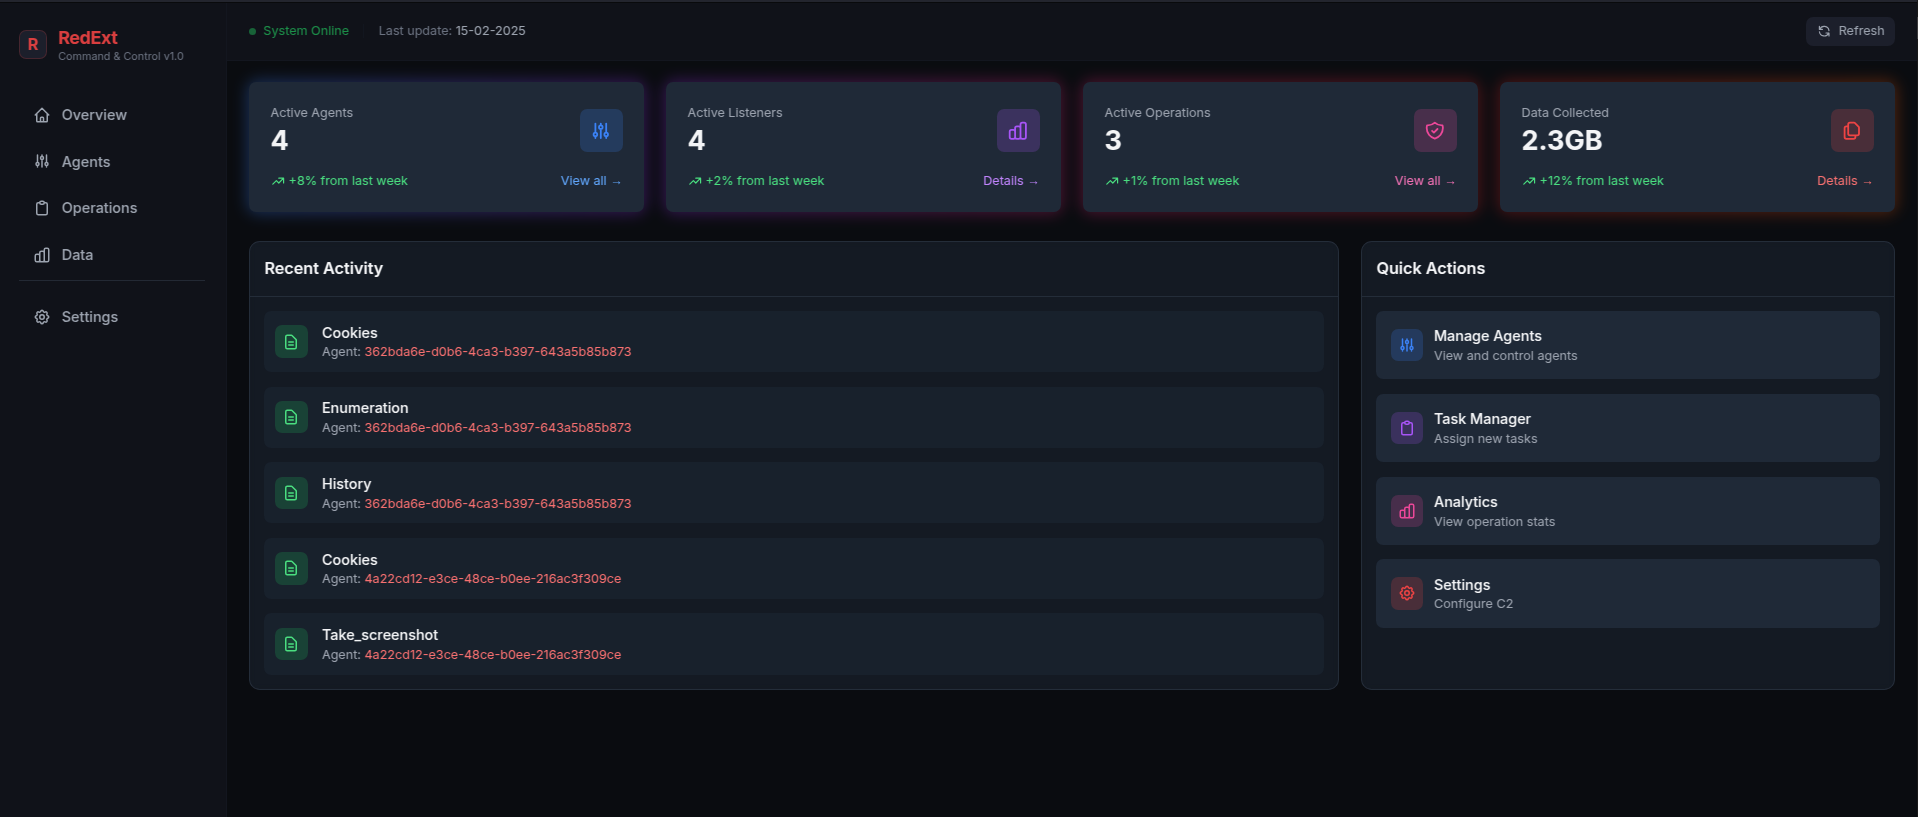
The main dashboard provides a real-time overview of:
- Total number of active agents
- Recent command execution history
- System health metrics
- Data collection statistics
Agent Management
Viewing Agents
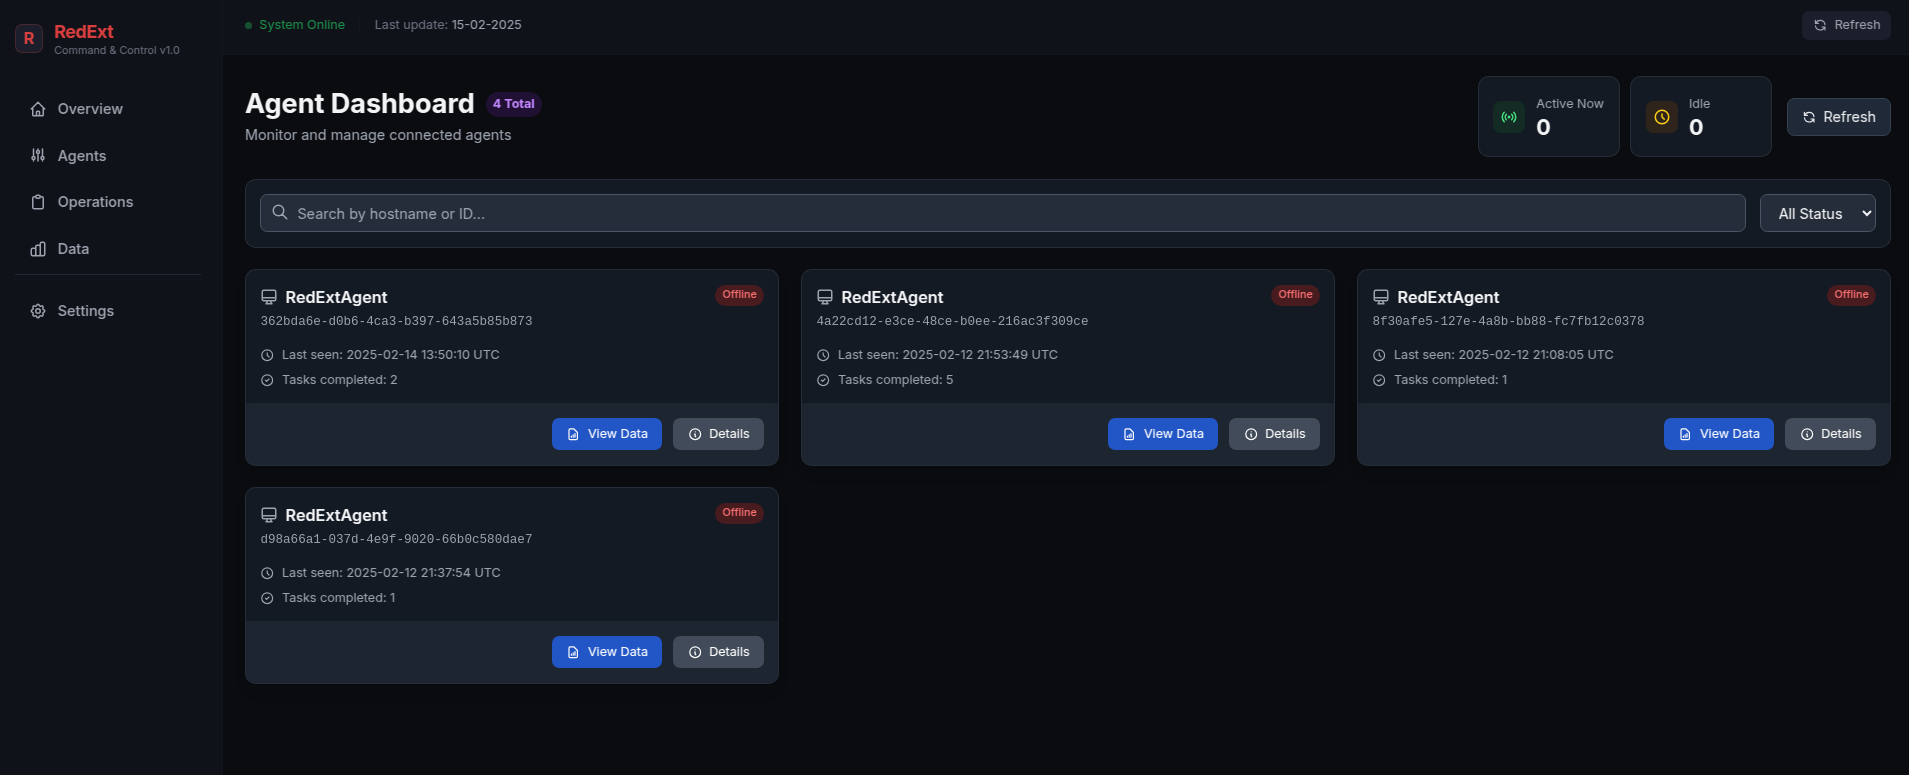
The agents panel shows:
- Agent ID and hostname
- Connection status and uptime
- Last check-in time
- Browser version and OS details
Agent Details
Click on any agent to view detailed information and available actions:
Quick Actions
- • Browser History Collection
- • Cookie Management
- • Screenshot Capture
- • DOM Snapshot
- • System Enumeration
- • Local Storage Dumper
- • Bookmark Export
- • Clipboard Monitoring
Agent Info
- • System Details
- • Permissions Status
- • Activity Timeline
- • Connection History
Task Execution
Creating Tasks
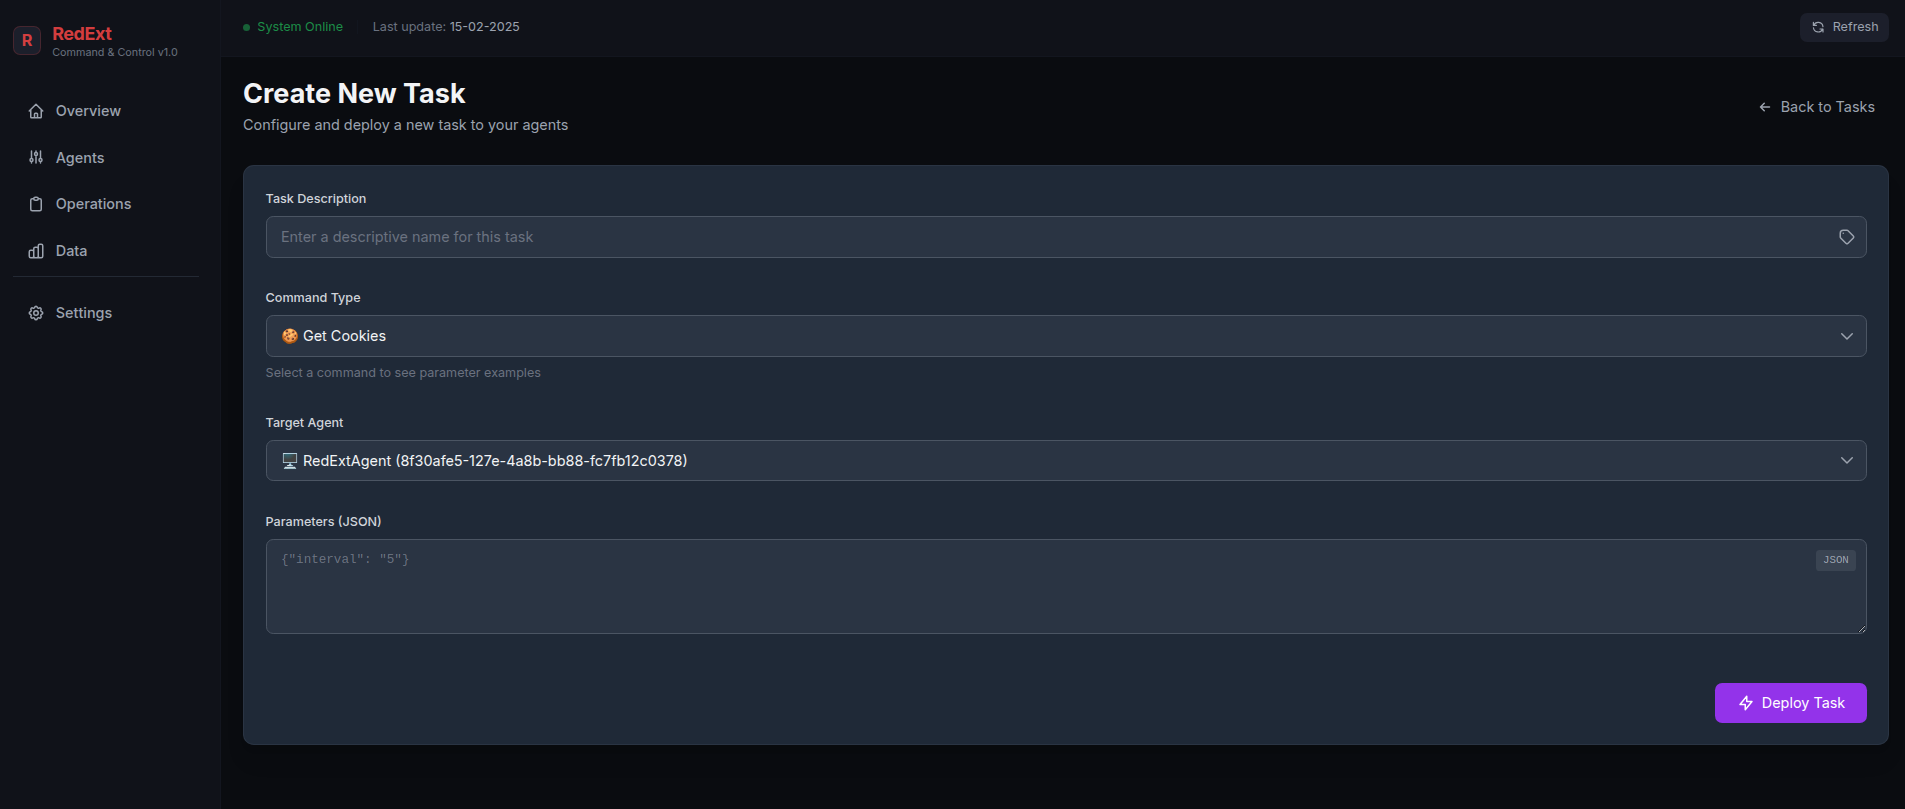
To create a new task:
- Select target agent(s)
- Choose command type
- Configure command parameters
- Set execution timing (immediate/scheduled)
Monitoring Tasks
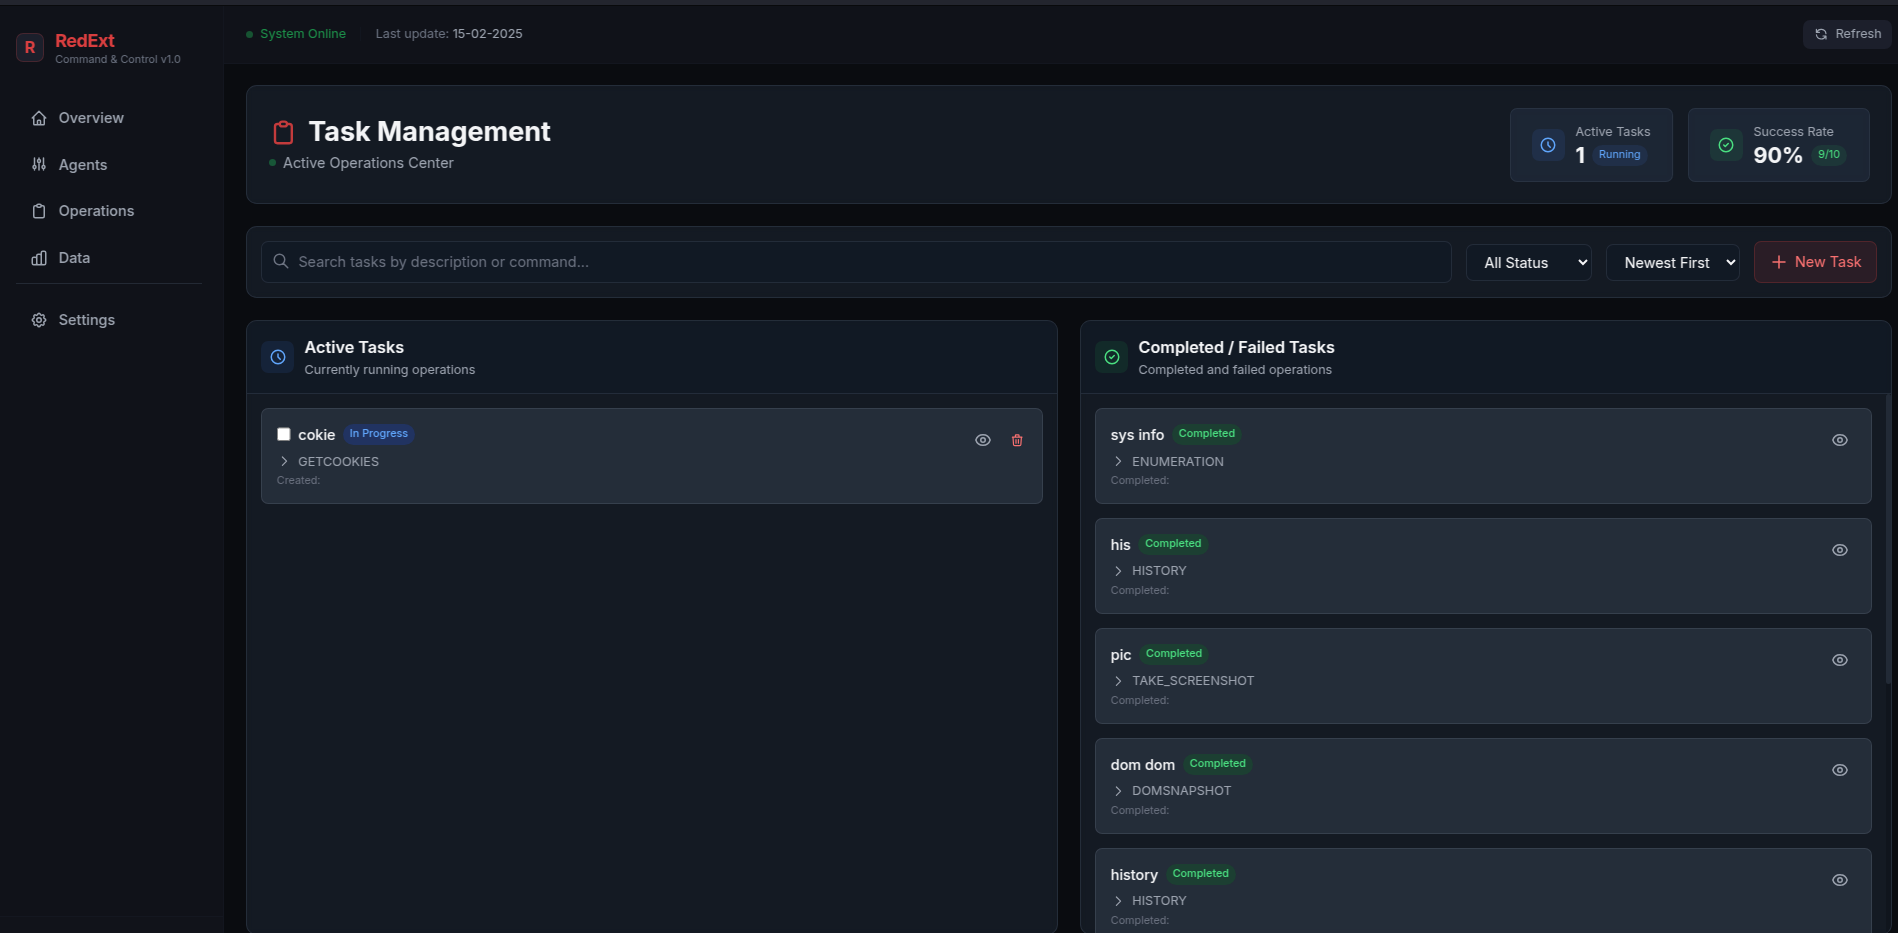
The task monitoring panel provides:
- Real-time execution status
- Task completion progress
- Error reporting and debugging
- Historical task records
Data Management
Collected Data Overview
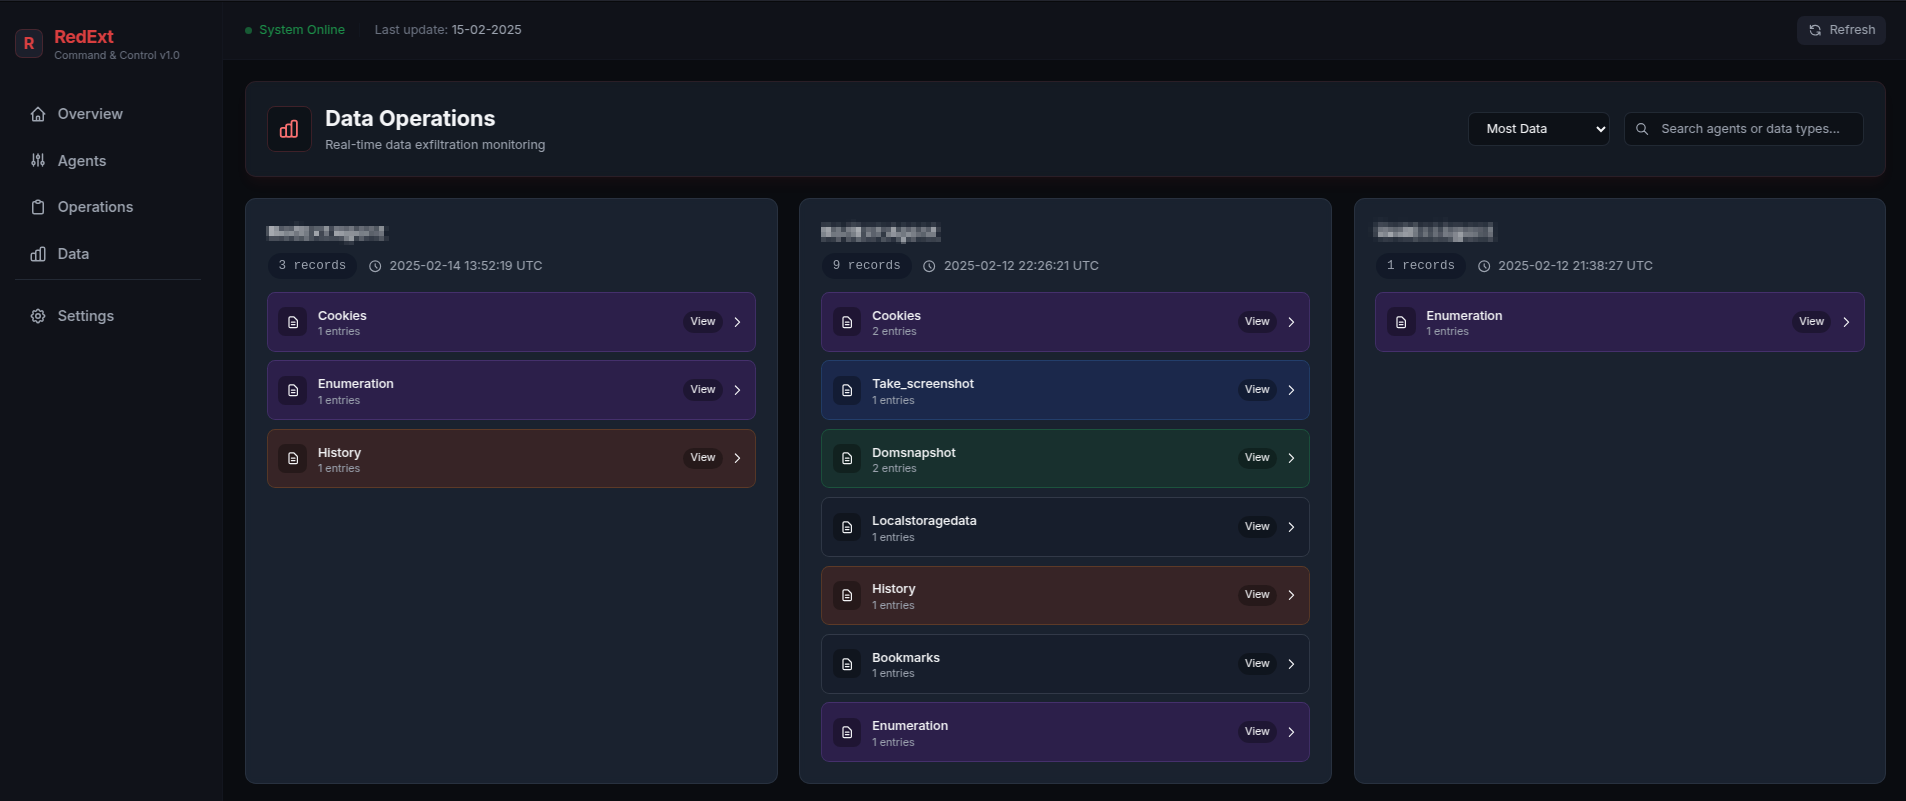
Access and manage collected data:
- Browse by data type (cookies, history, screenshots)
- Filter by agent or date range
- Export data in various formats
- Bulk data management operations